

Additional Climate-Related Disclosures
It is important for us to understand and respond to the impact of climate change on our business, including identifying and evaluating climate-related risks and opportunities.
In this section, we summarize additional aspects of our approach to climate change in line with the recommendations of the Task Force on Climate-related Financial Disclosures (TCFD).
Climate Risk Management
Delta’s climate strategy is informed and guided by the ongoing identification and assessment of climate-related risks and opportunities relevant to our business.
To help inform and strengthen our understanding and management of climate-related risks, we conducted climate risk assessments and scenario analyses in 2021, 2023 and 2025, aligning to the recommendations laid out by the TCFD.
Our 2025 risk assessment was conducted in alignment with the TCFD framework and included consultation with internal and external stakeholders and subject-matter experts, as well as a review of external research and data sources. Delta’s overall ERM program helps inform how we assess and manage our climate-related risks. For each risk, we considered potential impact, as well as the likelihood of and timeframe for the risk to manifest, under multiple emissions scenarios. Two scenarios were assessed for each physical and transition risk, covering the most relevant and high-impact scenarios (see the summary table). Where possible, potential financial impacts were assessed at a high level, with support and input from relevant internal teams. All risks and opportunities outlined are inherently speculative in nature, based on both internal and external assumptions and methodologies.
Our 2025 assessment incorporated new risks, new research findings and updated modeling to enhance our understanding of climate-related physical risks and transition risks in the short, medium and long term, as applicable. Additionally, our evaluation of some physical risks now takes into account mitigations that have been implemented, reducing potential impact for several risks.
The results of our 2025 risk assessment, including the key physical and transition risks identified and their anticipated timelines, potential impacts and related management strategies, are available below.
Forecast and Scenario Analysis
Scenario analysis helps us better understand and make strategic decisions in response to different possible climate futures.1 Given the differing nature of physical and transition risks, we have used different scenarios for each type. For physical risk analysis, we used the Shared Socioeconomic Pathway (SSP) scenarios developed by the Intergovernmental Panel on Climate Change (IPCC). For transition risk analysis, we used scenarios from the International Energy Agency’s (IEA) World Energy Outlook 2025.
| Physical Risks | Transition Risks and Opportunities | |
|---|---|---|
| Low-Emissions Scenario | Not assessed | IEA Net-Zero Emissions by 2050 (NZE) |
| Projected warming by 2060 | Not assessed | 1.5°C |
| Medium-Emissions Scenario | IPCC SSP 4.5 | Not assessed |
| Projected warming by 2060 | 1.6 – 2.5°C | Not assessed |
| High-Emissions Scenario | IPCC SSP 8.5 | IEA Stated Policies Scenario (STEPS) |
| Projected warming by 2060 | 1.9 – 3.0°C | 2.4°C |
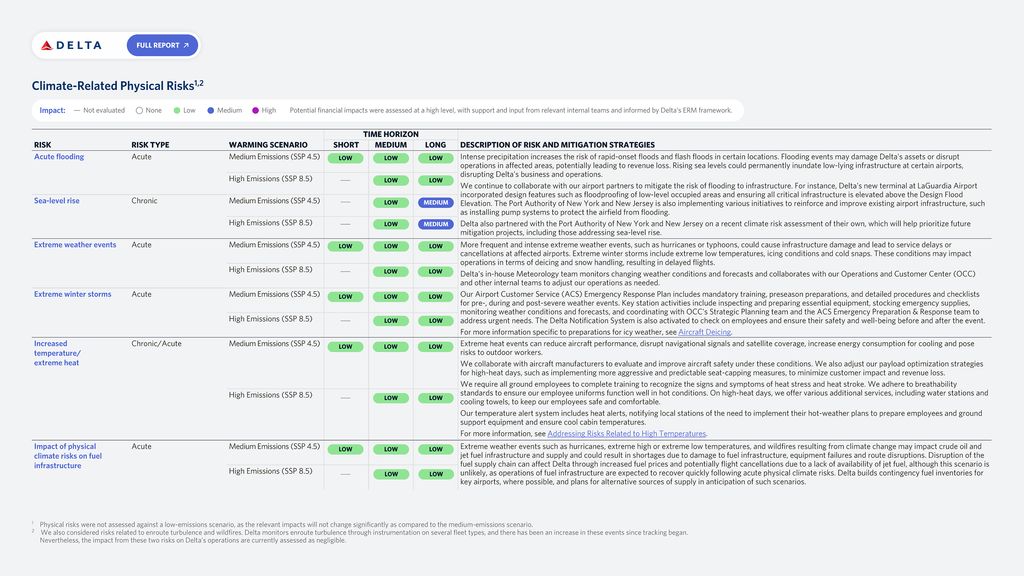
PHYSICAL RISK ASSESSMENT
Extended interruptions in service or other disruptions resulting from climate-related physical events, such as extreme weather, flooding and sea-level rise, could have an adverse effect on Delta’s business if they are not mitigated. To identify and assess these risks, we evaluated the potential impact and likelihood of specific climate-related events occurring at our most strategically important domestic and international airports and other potentially vulnerable locations. Estimated impacts were assessed based on anticipated effects in the short (2027), medium (2030-2035) and long (2035-2050) term under a medium-emissions scenario (IPCC SSP 4.5) and the medium and long term under a high-emissions scenario (IPCC SSP 8.5).
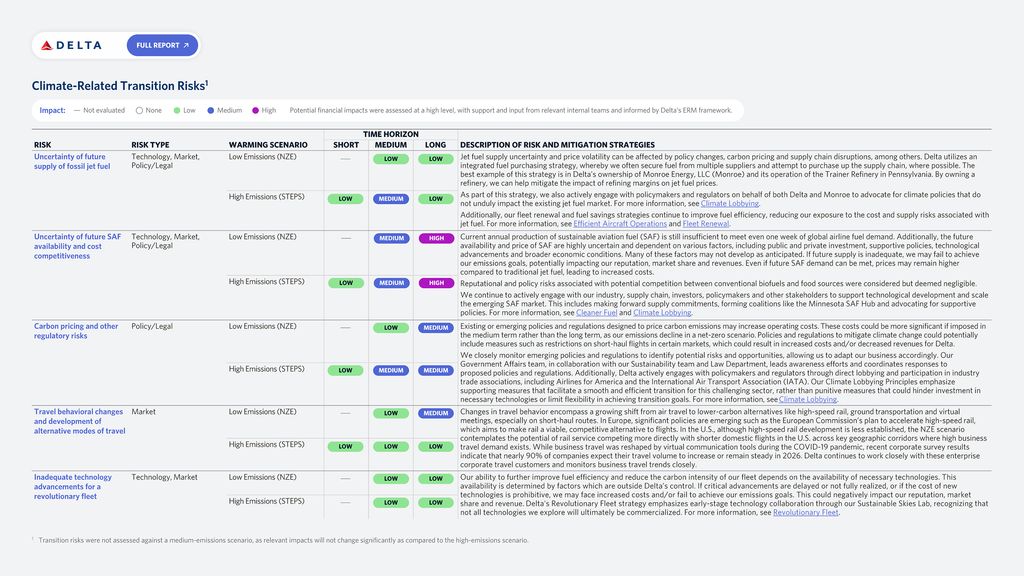
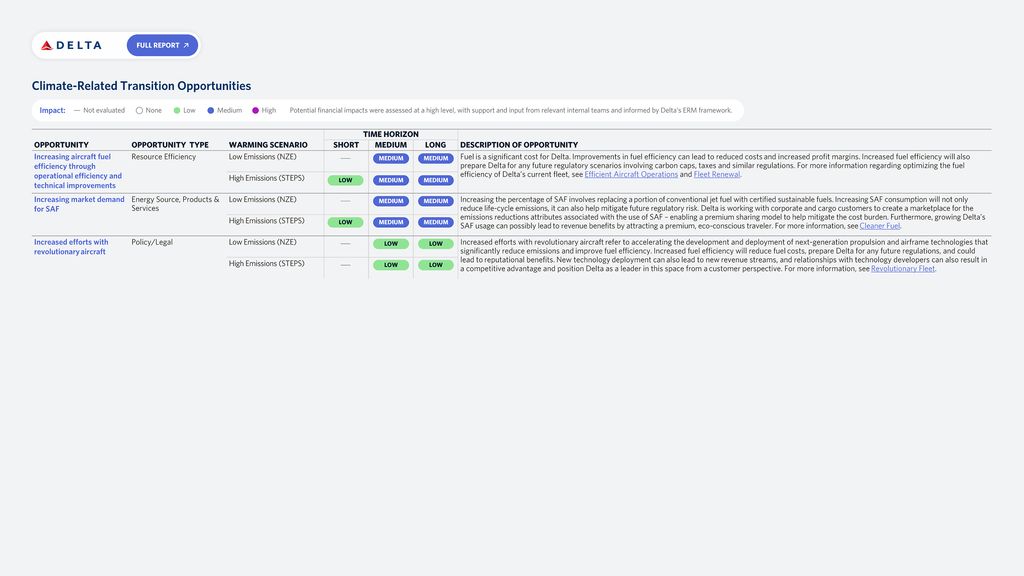
TRANSITION RISK AND OPPORTUNITY ASSESSMENT
Transition risks and opportunities are those driven by potential market, policy and legal, technology and reputational effects arising from the transition to a low-carbon economy. Within our industry, this is likely to include financial and operational challenges related to the transition away from fossil-based jet fuel, possible changes in customer behavior and preferences and potential costs stemming from the regulation and/or pricing of continued GHG emissions.
For our updated analysis, the specific transition risks were assessed across multiple dimensions and considered dependencies across each scenario for each risk.
Estimated impacts were assessed based on anticipated effects in the short (2027), medium (2030-2035) and long (2035-2050) term under a high-emissions scenario (IEA Stated Policy Scenario, “STEPS”) and the medium and long term for a low-emissions scenario (IEA Net Zero Emissions by 2050 Scenario, “NZE”).
Metrics and Targets
GHG EMISSIONS INVENTORY
Our Scopes 1 and 2 GHG inventory encompasses emissions from all operations directly controlled by Delta, including Endeavor, Delta Vacations, Delta Material Services and Delta Flight Products. Emissions from Monroe Energy, our wholly owned subsidiary, are excluded, except for those categorized as Scope 3, Category 3 emissions.2
Our GHG inventory also includes Delta’s most relevant and material upstream and downstream Scope 3 emissions categories.
2.3%
increase in Delta's 2025 emissions from jet fuel (Scope 1 & Scope 3, Category 3) compared to our 2019 baseline
8.2%
overall capacity growth on an available seat miles (ASMs) basis over the same time period
The vast majority of Delta's absolute emissions growth over this timeframe is due to methodology changes and addition of Scope 3 categories
Delta’s GHG emissions inventory is calculated and verified in accordance with the GHG Protocol, which aligns with the SBTi framework. More detailed figures are provided in the Appendix.
SCOPE 1
Consists of all direct emissions generated by Delta’s airline operations, including the combustion of jet fuel and SAF by Delta mainline aircraft and wholly owned subsidiaries, fuel use for ground support equipment and other ground operations, and chemical use.
SCOPE 2
Consists of GHG emissions resulting from the generation of electricity, heat or steam purchased by Delta in owned and leased facilities where Delta is directly billed for utilities.
SCOPE 3
Delta calculates and discloses our indirect value chain emissions from purchased goods and services; capital goods; emissions from jet fuel and SAF production from our suppliers; well-to-wake GHG emissions from jet fuel from Delta Connection carriers that we do not wholly own; upstream transportation; waste generated in operations; business travel; employee commuting; energy use in upstream leased assets; and investments (Categories 1, 2, 3, 4, 5, 6, 7, 8 and 15).5
SCIENCE-BASED TARGETS
Delta has set medium- and long-term climate goals aligned with Science Based Targets initiative (SBTi) guidelines. Our ultimate goal is to achieve net-zero emissions for our airline operations by 2050.
In 2022, SBTi validated Delta’s medium-term climate target to reduce well-to-wake Scope 1 and 3 jet fuel GHG emissions 45% per revenue ton kilometer by 2035 from a 2019 base year.6 This target is aligned with holding warming well below 2°C. Validation of our 2050 net-zero target, however, has been delayed pending updated SBTi guidance for setting aviation sector targets aligned with limiting warming to 1.5°C. We continue to wait for updated aviation sector guidance from SBTi.